Energy & Environmental Science https://doi.org/10.1039/D3EE00658A
H. Yang, D. Chen*, R. Zhao, G. Li, H. Xu, L. Li, X. Liu, G. Li, D. Chao and W. Han*
Although sulfate- and sulfonate-based electrolytes have been widely used in the study on aqueous zinc-ion batteries (AZIBs),the discrepancies in the Faradaic reaction kinetics of cations interfacial chemistry including Mn2+ redox reaction and Zn deposition are observed in these two systems, mechanism of which is still unclear. Herein, through focusing on the electrolyte solvation structure, we constructed a specific adsorption model involving the coexistence of anions, cations, and water molecules in the electrode/electrolyte interface. Distinguished from the traditional investigation of isolated adsorbed particles, we demonstrate that the specific adsorption model enables a rational explanation on reaction difference of cations with different solvation structures on the electrode/electrolyte interfaces (EEI). Specifically, owing to the more intense adsorption of active solvated Mn2+ near the inner Helmholtz plane, the deposition reaction of Mn species is enhanced in sulfate-based electrolyte, resulting in stronger capacity increase and fluctuation in comparison with sulfonate electrolyte. Similarly, a more rapid Zn2+ deposition kinetic in sulfate-based electrolyte can be attributed to its strong adsorption behavior at EEI. Furthermore, as a validation of the as-proposed model, a sulfate/sulfonate hybrid electrolyte system is proposed, in which the optimized adsorption behavior at EEI endows it with synergistic improvement both in the capacity and cycling stability for aqueous Zn-Mn cells. This work provides a rationale for understanding the interfacial electrochemistry in various aqueous electrolyte systems from the view of the adsorption behavior of the solvation structure.
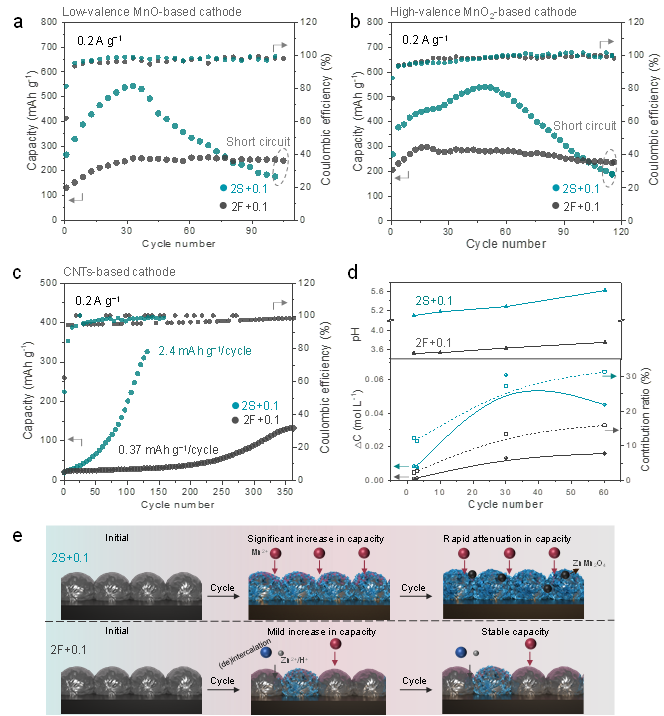
Figure 1. Electrode-independent capacity fluctuation of Zn-Mn cells in 2S+0.1 and 2F+0.1 electrolytes. Cyclic performance comparison of the cells in the different electrolytes using (a) low-valence MnO-based cathode, (b) High-valence MnO2-based cathode, and (c) deposition-only CNTs-based cathode of 0.2 Ag−1 . (d) Electrolyte behavior monitoring for MnO- based cathode: the pH value at 1.85 V for different stages (upper) and the concentration changes (rectangle) and contribution ratios (ball) of the Mn2+ (bottom). (e) Scheme for abnormal behavior of Mn-deposition in both electrolytes. The gray ball represents the electrode material, and the blue sheet structure represents manganese deposits.
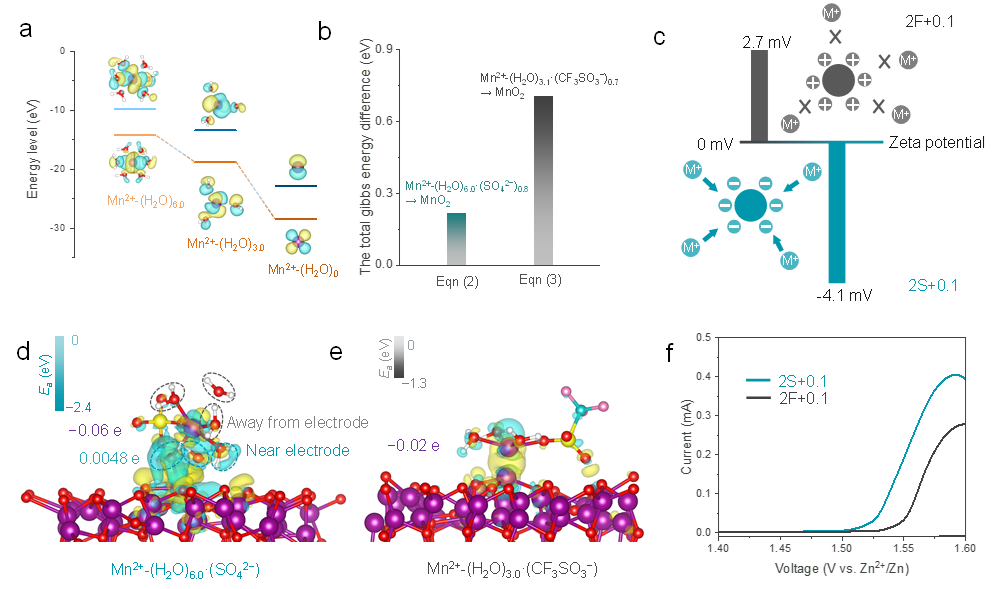
Figure 2. Adsorption investigation of solvation structure for cathode. (a) HOMO/LUMO energy levels of Mn2+ combining with different number of H2O. (b) Total Gibbs energy differences for Mn deposition corresponding to Eqn (2-3), respectively. (c) Zeta potential of MnO-based cathode in 2S+0.1 and 2F+0.1 electrolyte. (d-e) The charge density difference for demonstrating interfacial adsorption model of cathode for solvation structures (front view). The purple characters represent the Bader charge of Mn. Cyan character stands for Bader charge of water molecules near the electrode surface. The involved color code: Red O, white H, cyan C, yellow S, pink F, and purple Mn. (f) CV curve of Zn/MnO-based battery in 2S+0.1 and 2F+0.1 electrolyte.
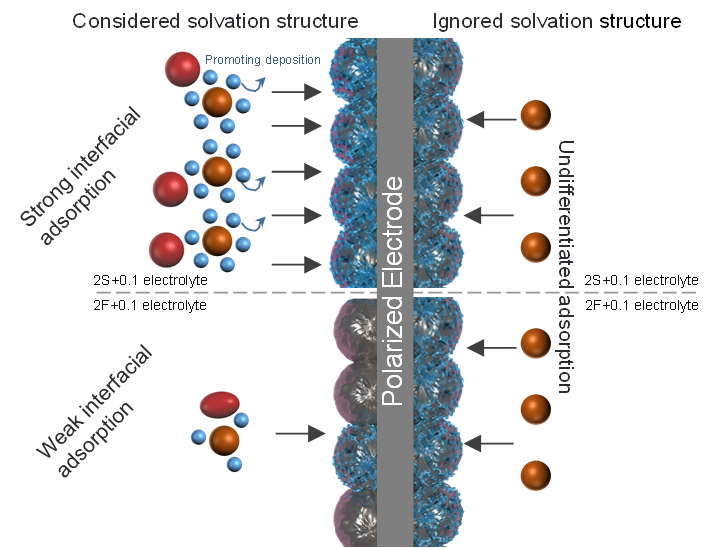
Figure 3. Schematic illustration of Faradaic process of Mn deposition by ignoring or considered solvation structure.
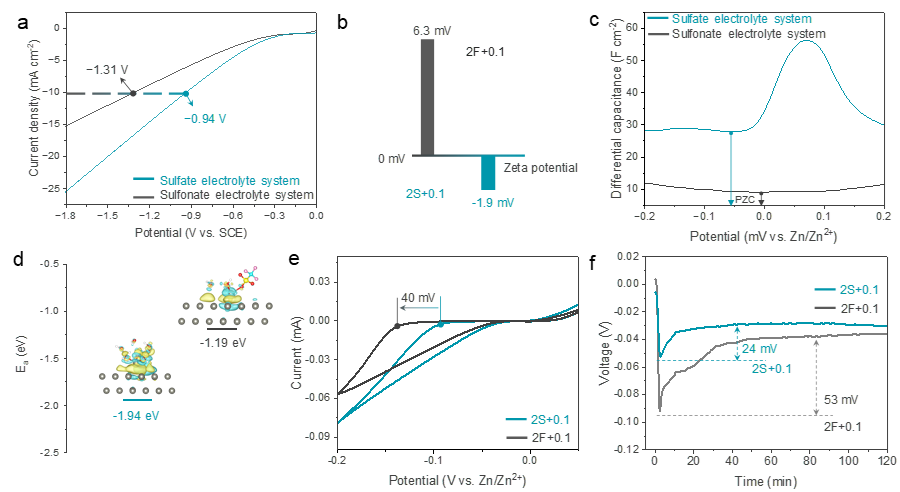
Figure 4. Specific adsorption investigation of electrolytes for Zn anode. (a) HER investigation in the different system electrolytes. Note that in order to avoid interference to HER by the Faradaic reaction of Zn2+, the corresponding sodium salt is used as the test solute. (b) Zeta potential of Zn metal. (c) The differential capacitance-potential curves of Zn electrodes. The corresponding sodium salt is used as the test solute to avoid Faradaic reaction of zinc deposition. (d) Adsorption energy Ea of specific adsorption clusters on zinc surface. The illustration shows the optimized configuration. The involved color code: Red O, white H, cyan C, yellow S, pink F, and gray Zn. (e) The CV curves of the Zn anode. (f) Initial Zn nucleation overpotential of Zn/Zn symmetric cells at 2 mA cm–2 .
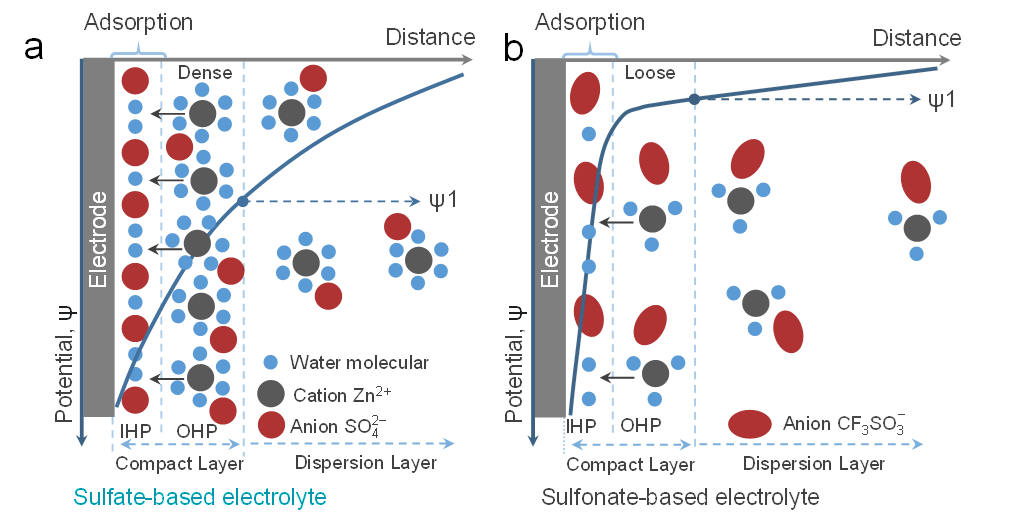
Figure 5. The adsorption behavior with the consideration of the solvation structure at EEI layer for (a) 2S+0.1 electrolyte and (b) 2F+0.1 electrolyte. Note that we find negative potentials near the interface based on investigations such as Zeta potential and PZC tests, so only anions and water molecule are shown in IHP as comparation.
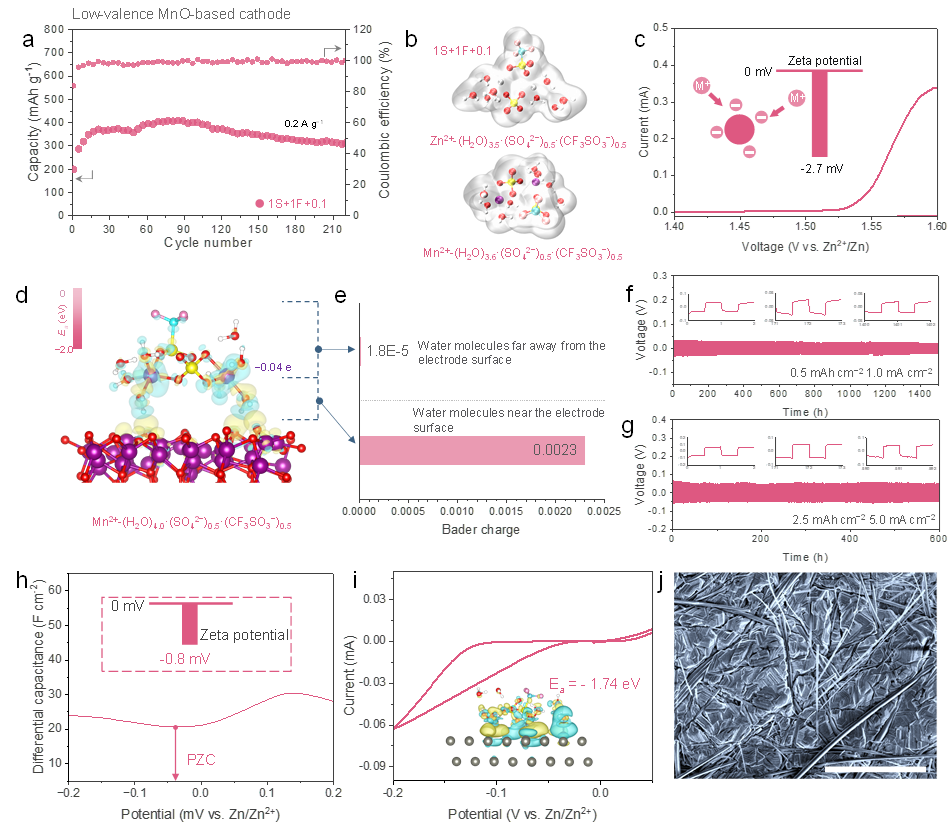
Figure 6. Redesign of electrode behavior guided by specific adsorption model. (a) Cyclic performance of the cells in 1S+1F+0.1 electrolyte using MnO cathode of 0.2 A g−1 . (b) Schematic view of the primary solvation shell of Zn2+ and Mn2+ obtained from MD simulations in 1S+1F+0.1 electrolyte. (c) CV curve of Zn/MnO-based battery in 1S+1F+0.1 electrolyte. The inset is Zeta potential of MnO-based cathode in 1S+1F+0.1 electrolyte. (d) The charge density difference for demonstrating interfacial adsorption model of cathode for specific solvation cluster evolving from solvation structure in the bulk electrolyte (front view). (e) The Bader charge of the water molecule obtained by optimizing the electrode surface configuration. Zn|Zn symmetrical cells to investigate the cycling performance with different area capacities and current densities of (f) 1 mAh cm−2 and 0.5 mA cm−2 , (g) 2.5 mAh cm−2 and 5 mA cm−2 in 1S+1F+0.1 electrolyte. (h) The differential capacitance-potential curves of Zn electrodes in 1S+1F+0.1 electrolyte. The corresponding sodium salt is used as the test solute to avoid Faradaic reaction of zinc deposition. The inset is Zeta potential of Zn metal. (i) The CV curves of the Zn anode. Adsorption energy Ea of specific adsorption clusters on zinc surface. The inset is the optimized specific adsorption configuration of solvation structure on Zn metal. (j) SEM images of cycled Zn anode at 5 mA cm-2 and 2.5 mAh cm-2 under the 1S+1F+0.1 electrolyte. Scale bar: 50 μm.